In addition to the Character Error Rate, it is possible to calculate the accuracy of a Text Recognition model on new pages. It is a useful test before running a model on an entire document or collection
Previous step: Character Error Rate and Learning Curve
This feature is not supported in Transkribus at the moment. In the meantime, you can use it within Transkribus eXpert.
Transkribus eXpert (deprecated)
You can measure the accuracy of your model on specific pages with the “Compute Accuracy” feature in the “Tools” tab.
To do so, you first need two versions of the transcription: the Ground Truth (i.e. the manual transcription as close to the original text as possible) and the transcript generated by the Text Recognition model.
To get the most significant value from the accuracy measurement, it would be best to use pages which have not been used during the training process and therefore are new to the model. Using pages from the Validation Set is also an option but not as ideal as completely new pages. Using pages from the Training Set is not a good idea because this will output CER-values that are lower than they actually are.
To make the comparison, you have to select two transcription versions of the same page. Choose as “Reference” the Ground Truth page version and as “Hypothesis” the version that was automatically generated with the Text Recognition model and on which you would like to test how good the result is.
You can change the versions to be compared by clicking on the grey button next to “Reference” and “Hypothesis”. Double-click to choose the desired version of the document in the appearing window. The versions that can be selected for “Reference” and “Hypothesis” are different versions of your document, which have been created after running a new job or saving transcriptions.
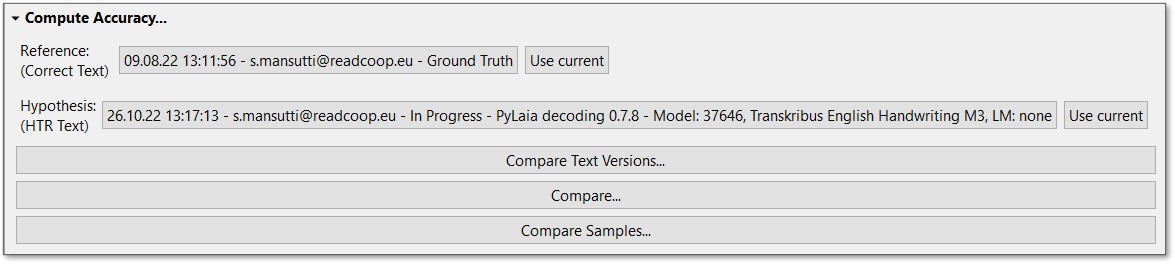
There are three comparison options available:
- Compare Text Versions:
This feature gives you a visual representation of what the HTR model transcribed correctly and incorrectly.
After selecting the Reference and Hypothesis versions, click on “Compare Text Versions…” The words marked in red are the ones transcribed incorrectly by the Text Recognition model; in green, the words are shown as written in the Ground Truth transcription. Please note that even if only one character is wrong, the whole word is marked in red. In the passages without colour, the recognised text is identical to the Ground Truth. - Compare and measure the CER:
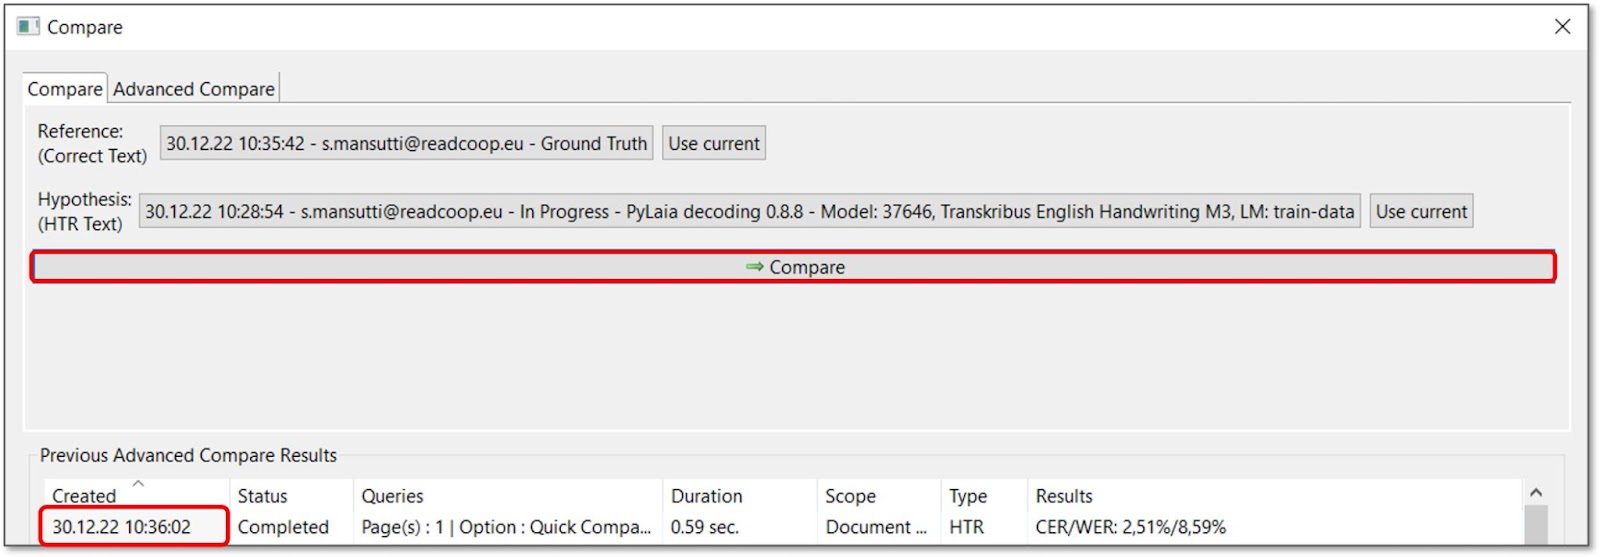
This accuracy check enables you to compare the two versions of the same page and measure the Chacareter Error Rate (CER) and Word Error Rate (WER) on that page.
To access it, click on “Compare…”. Firstly, please make sure the right versions have been selected as Reference and Hypothesis in the upper section of the appearing window. Then hit the “Compare” button. The result will be shown in the lower section of the window after a few seconds.
The values are calculated for the page you have currently loaded in the background. In the image above, we have a CER of 2.51% on that page, which means that 97.49% of the characters in the automated transcript are correct.
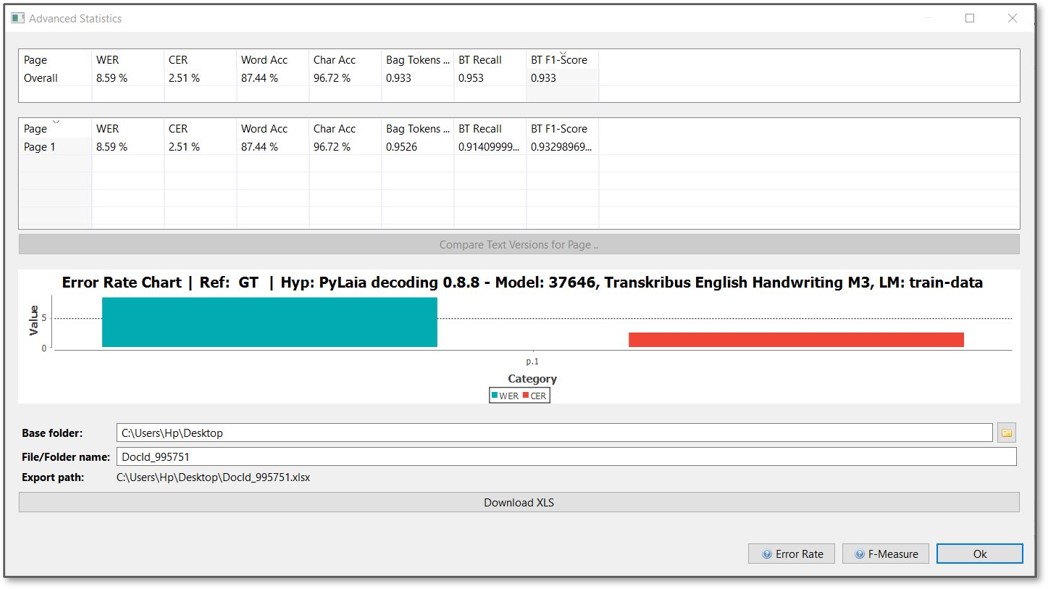
By double-clicking the date and time within the “Created” column of the simple comparison tab, you will automatically arrive at the “Advanced Statistics” window. Here you will get more detailed indications and values, and the results can be exported into an Excel file.
The tables and the chart displays the accuracy of the Text Recognition model on that page in terms of Word Error Rate and Character Error Rate. By double-clicking the line with the page number, you will arrive at the text comparison, where you can check which words or text passages have been challenging.
If you want to check the accuracy for more pages at once, when opening the “Compare” window, you can choose the “Advanced Compare" tab on the right. Add the pages you would like to evaluate (e.g. 1-6), or click on the button with the three points on the far right to choose individual pages.
After starting the accuracy check by clicking on “Compare”, the results will be shown in the table below and by double-clicking the date and time cell in the “Created” column, you will arrive at the “Advanced Statistics” window again.
The overview display shows two tables: one with the “Overall” value, which is the average value of the recognition on all the computed pages in the document. In the table below, you can find the values for the individual pages. This way, you can compare the results on different pages, and by double-clicking the line, you will arrive at the text comparison, where you can check which words or text passages have been challenging. Note: The weighting of pages for the “Overall” value is calculated based on the number of recognised words on a page. - Compare Samples
The “Compare Samples” functionality is useful if you are planning a bigger recognition project and would like to evaluate which model to choose before you run it on the whole document. This comparison feature chooses random lines from the sample document and tests the performance of the model on these lines.
It makes sense to put some pages aside at the beginning in order to use them as a sample document. This is advantageous, as the material the model will be tested on has not been seen before, and therefore the evaluation result will be more reliable.
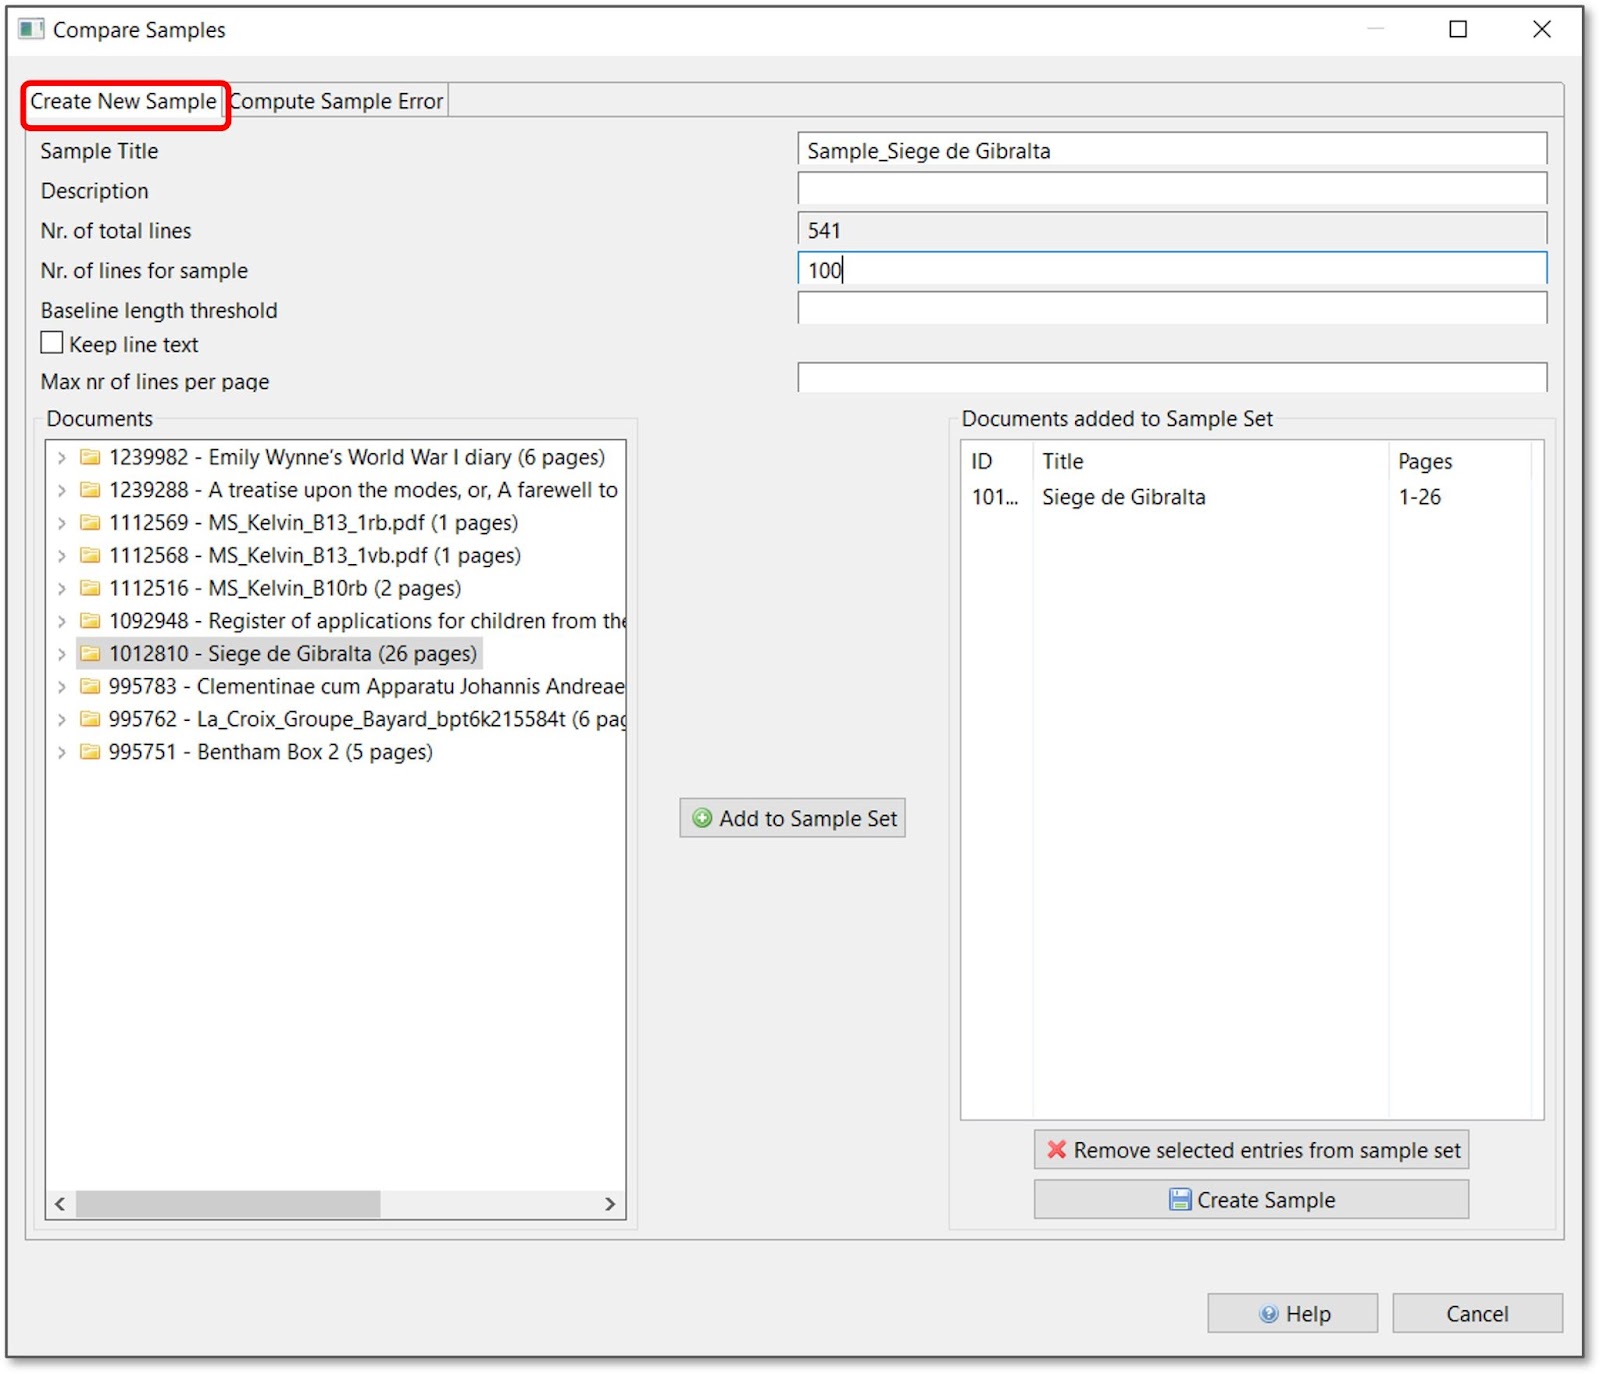
The “Compare Samples” functionality is situated within the “Tools” tab in the “Compute Accuracy” section. To open it, click on “Compare Samples”, and under “Create New Samples”, fill out the required information.
At “Nr. of lines for sample”, you can define how many lines you would like to test. 500 is the recommended average. The more lines you put here, the lower the variation will be in the result, and the prognosis will be more precise. For a large project with many pages, it might be reasonable to say 1000 lines; for a very small attempt, maybe 100 lines are already enough. Here too, the best way to go about it is a “trial and error” approach, as it always depends on the individual goal.
With the “Baseline length threshold”, you can control the length of lines, which is practical if you have a lot of short lines in your material, which often happens e.g. with tables and newspapers. The value to enter should be between 0 and 1 (e.g. 0.5 for half the page width). If set, baselines with a length smaller than this fraction of the page width will be discarded. For handwritten material with only one column, this step is probably not necessary.
By clicking the “Keep line text” option, you can literally keep the text you already have in your documents and only need to correct the lines after creating the sample.
From the list on the left side, choose the documents of which the sample should consist via the “Add to Sample Set button”. Then click on “Create sample”. Transkribus will now randomly choose the defined number of lines in the selected documents.
The next step is to open the sample document (you can find it in your collection) and manually transcribe the line snippets (if you haven’t kept the text like described above). It will be only one line per page, and therefore the transcribing in most cases will be quick. If you have finished one line, jump to the next page of the sample document to proceed.
When you are finished with transcribing, run the model which you would like to test on the sample document to produce the transcription.
You can then compare the two versions. To do so, open the “Compute Sample Error” tab in the “Compare Samples” window and choose the sample you would like to evaluate. Then click on “Compute” to start the job. As soon as “Completed” appears in the “Status” column, you can double-click the cell in the “Created” column to view the results.
By double-clicking the date and time in the “Created” column in the “CER per sample page” table, you will automatically arrive at the “Advanced Statistics” window and look at the accuracy measurements more in detail.