The Character Error Rate measures the performance of the model; the Learning Curve graph shows how the model learnt throughout the training
Previous step: Model Setup and Training
Character Error Rate
The performance of a model is determined based on the “distance” between a perfect transcription (your Ground Truth) and the automatically recognised text and is measured by the Character Error Rate (CER).
The Character Error is the percentage of characters that have been transcribed incorrectly by the Text Recognition model.
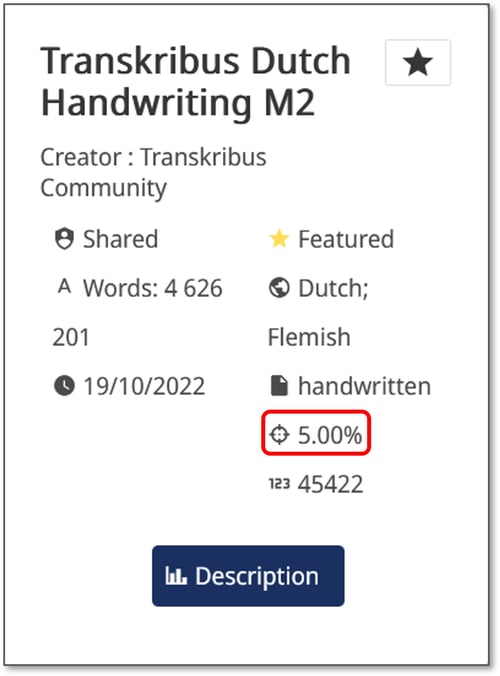
For example, a 5% CER means that the text model has automatically transcribed correctly 95 characters out of 100, while it has misread only 5 characters.
The CER you see among the model’s details in the Model Manager is measured on the pages of the Validation Data and shows how the Text Recognition model performs on pages on which it has not been trained.
 Results with a CER of 10% or below can be considered very efficient for automated transcription. However, if applied on hands not seen during the training or on scribble notes, the model may perform worse. Results with a CER of 20-30% are sufficient to work with powerful searching tools like Smart Search.
A good CER for printed text is between 0.5 and 2%, while for handwritten text, it ranges between 2 and 8%, depending if the model has been trained on one or multiple hands.
It is common to train multiple models before achieving a satisfactory result. If your first attempt does not meet your expectations, don't give up! Keep trying and refining your models until you achieve the desired outcome.
Learning Curve
The “Learning Curve” graph signifies the accuracy of your model. Open the model’s Description to see it.
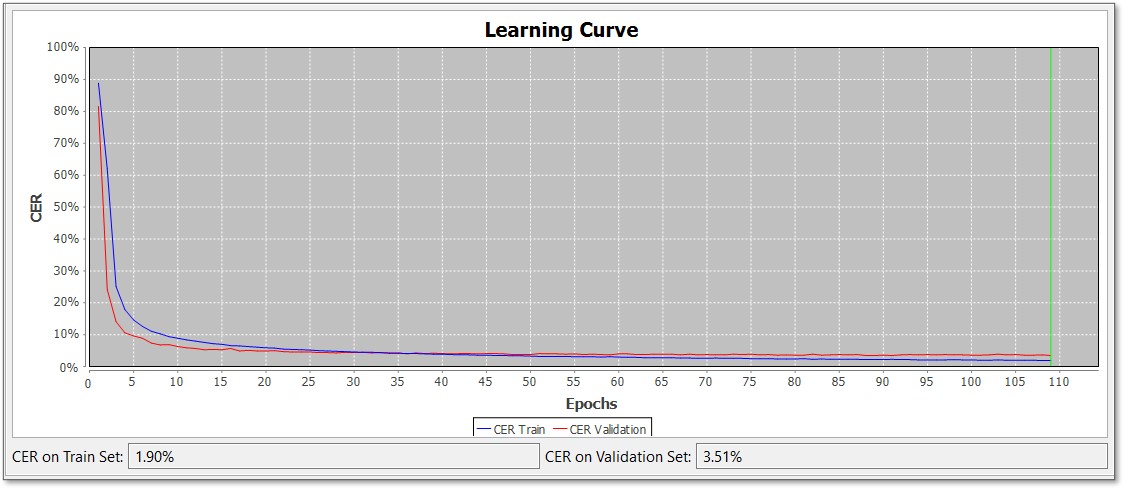
The y-axis represents the Character Error Rate. The curve goes down as the training progresses and the model improves.
The x-axis represents the Epochs, i.e. the training progress. During the training process, Transkribus makes an evaluation after every epoch.
In the figure below, 109 epochs were trained. In this case, the maximum number of epochs was set to 250, but the training was automatically stopped at 109 because the model no longer improved.
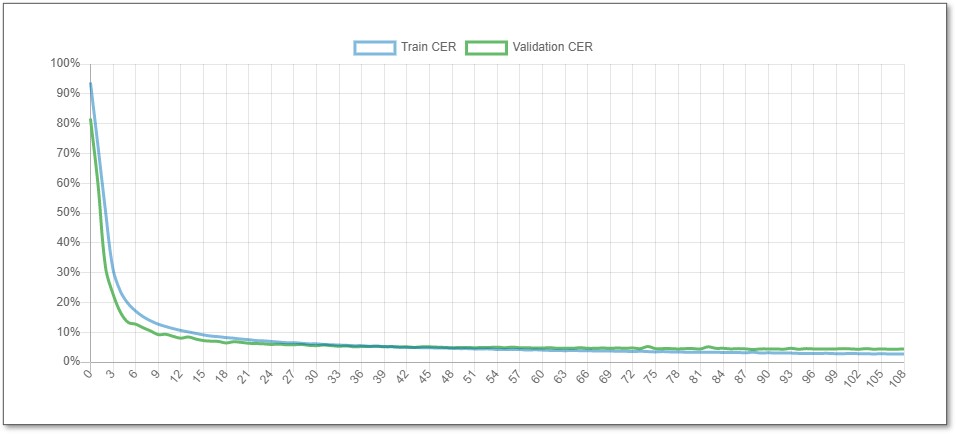
The graph shows two lines, one in blue and one in green. The blue line represents the progress of the training. The green line represents the progress of evaluations on the Validation Data. The Validation CER is more representative because it shows how the model should perform on new pages not seen during the training.
Next section: Computing Accuracy
Transkribus eXpert (deprecated)
Character Error Rate
The performance of a model is determined based on the “distance” between a perfect transcription (your Ground Truth) and the automatically recognised text. It is measured by the Character Error Rate (CER), i.e. the percentage of characters that have been transcribed incorrectly by the Text Recognition model.
In the Details of the model, you see the CER on both the Training and the Validation Set. 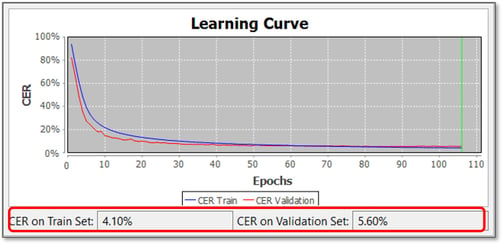
The most representative CER is the one measured on the Validation Set because it shows how the model performs on pages on which it has not been trained.
Results with a CER of 10% or below can be seen as very efficient for automated transcription. However, if applied on hands not seen during the training or scribble notes, the model may perform worse. Results with a CER of 20-30% are sufficient to work with powerful searching tools like Smart Search.
Learning Curve
The “Learning Curve” graph signifies the accuracy of your model.
The y-axis represents the Character Error Rate. The curve goes down as the training progresses and the model improves.
The x-axis represents the Epochs, i.e. the training progress. During the training process, Transkribus makes an evaluation after every epoch.
In the figure below, 109 epochs were trained. In this case, the maximum number of epochs was set to 250, but the training was automatically stopped at 109 because the model no longer improved.
The graph shows two lines, one in blue and one in red. The blue line represents the progress of the training. The red line represents the progress of evaluations on the Validation Set.